Visual analytics: Aimless wandering or Systematic data exploration
- Abhishek Tiwari
- Opinion
- 10.59350/y9c59-wt290
- Crossref
- February 23, 2009
Table of Contents
With great power comes great responsibility.
One of my favorite quote from movie Spider-Man which was sourced by Stan Lee, famous American writer and editor. After working with visual analytics for three years I realized that this quote is utterly correct for visual analytics. Visual analytics is a new exploratory paradigm which combines visualization, human factors and data analysis. Human factors such as interaction, cognition, perception play central role in the final outcome of the analytics and decision making process.
Visual analytics is great and powerful tool but it requires a systematic approach to discover the unexpected. If your efforts are not well organized then probably your are anticipating aimless wandering. Due to latest technological advances now we are generating massive amount of complex data and finding useful information out of these data sets is like searching for needle in haystack.
So how can we make best use of technologies like visual analytics to increase the probability of discovering something out of the blue? Before that we need to ask what is visual analytics and what is not, and how to optimize the human factor in this process.
What is visual analytics and What is not
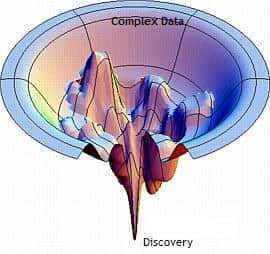
Visual analytics is an exploratory funnel, very much like folding funnel (a specific version of the energy landscape theory of protein folding), and to reach the endpoint of the this funnel (which is nothing but discovery) we have to go through many intermediate states. As expected one need to explore space before making any move. At the same time we have to minimize our efforts. So it is not just visual analysis, but it is more visual exploration providing better insight about data.
One of the biggest myth with visual analytics is that it makes discovery easy and faster, which is not true, although probability of discovering unexpected is niftier. Most of visual analytics tools have a very sharp learning curve, and it is essential to cover the basics adequately before diving into advanced methods. Each visual analytics technique is composed of interactive visualization, but not all interactive visualizations are visual analytics. This is very common mistake to use phrase visual analytics for normal visualization.
A visual analytics tool must establish a communication between user and visualization, for every action there should be a reaction, which force analyst to ask more questions by synthesis of visual reasoning. There is no such thing that visual analytics can be used with only complex and massive amount of data, visual analytics is scalable technique and allow to explore basic as well as complex problems.
Why visual analytics
Role of guided visual analytics
Generally complexity of visual analytics systems demands high-end analyst to solve analytical problems. There is extensive discussion about what should be scope of visual analytics, currently it is a complex analytical technique for sophisticated users empowering their specialized needs. How it can help casual users to solve not only their specialized problems but also their basic requirements. This problem can be solved by guided visual analytics workflows which gives ability to easily arrange a sequence of analysis steps into a workflow template that can be edited, reused and distributed.
In guided visual analytics specialized analysis workflows are created by high-end analyst and later these workflows can be passed to casual users making their life easier. This allows end users to address key analytical questions without needing to learn the advanced visual analytics techniques nor it requires to become an expert user. Guided analysis workflow are easy to use and give more insight by providing easy access to advanced visual analytics techniques. Guided workflow is best way to optimize the human factor in visual analysis process.
Visual analytics not only to permit users to detect expected, which might be captured by any other analysis tool such as different data mining applications, but also to help users discover hidden patterns, and relationships in complex relational data. Of course if data is not very complex there is no reason that you can not find all patterns using another tool, but when data is large and heterogeneous it become hard to follow conventional analysis systems, but this hidden discovery does not come for free.
Currently the visual analytics software cost a lot which is one of the reasons that people are less aware about potential applications of this technique. Before acquiring any visual analysis systems you must realize your requirement and the full potential of the visual analytics systems.
Some Popular Visual Analytics Tools
Currently TIBCO Spotfire and Tableau seem to be undisputed leaders in the visual analytics space.